Plotly support in GoFigr
October 12, 2023
We are thrilled to announce that GoFigr now supports Plotly, including the ability to publish fully interactive plots. If you are using the GoFigr client library version 0.15.0 or greater, Plotly is now enabled by default. This includes autopublish: GoFigr will automatically detect and publish your Plotly figures — no boilerplate necessary.
Advanced configuration
You can enable/disable Plotly (and other backends, e.g. matplotlib) in the call to configure:
%load_ext gofigrfrom gofigr.jupyter import *from gofigr.backends.matplotlib import MatplotlibBackendfrom gofigr.backends.plotly import PlotlyBackend
configure(...,          auto_publish=True,          backends=(MatplotlibBackend, PlotlyBackend))
Example
To publish a Plotly figure, create a go.Figure object like you normally would, then simply call publish(). You may skip the call to publish if you have auto_publish set to True:
%load_ext gofigr
from gofigr.jupyter import *import plotly.graph_objects as go
configure(analysis=FindByName("Interactive plots", create=True))
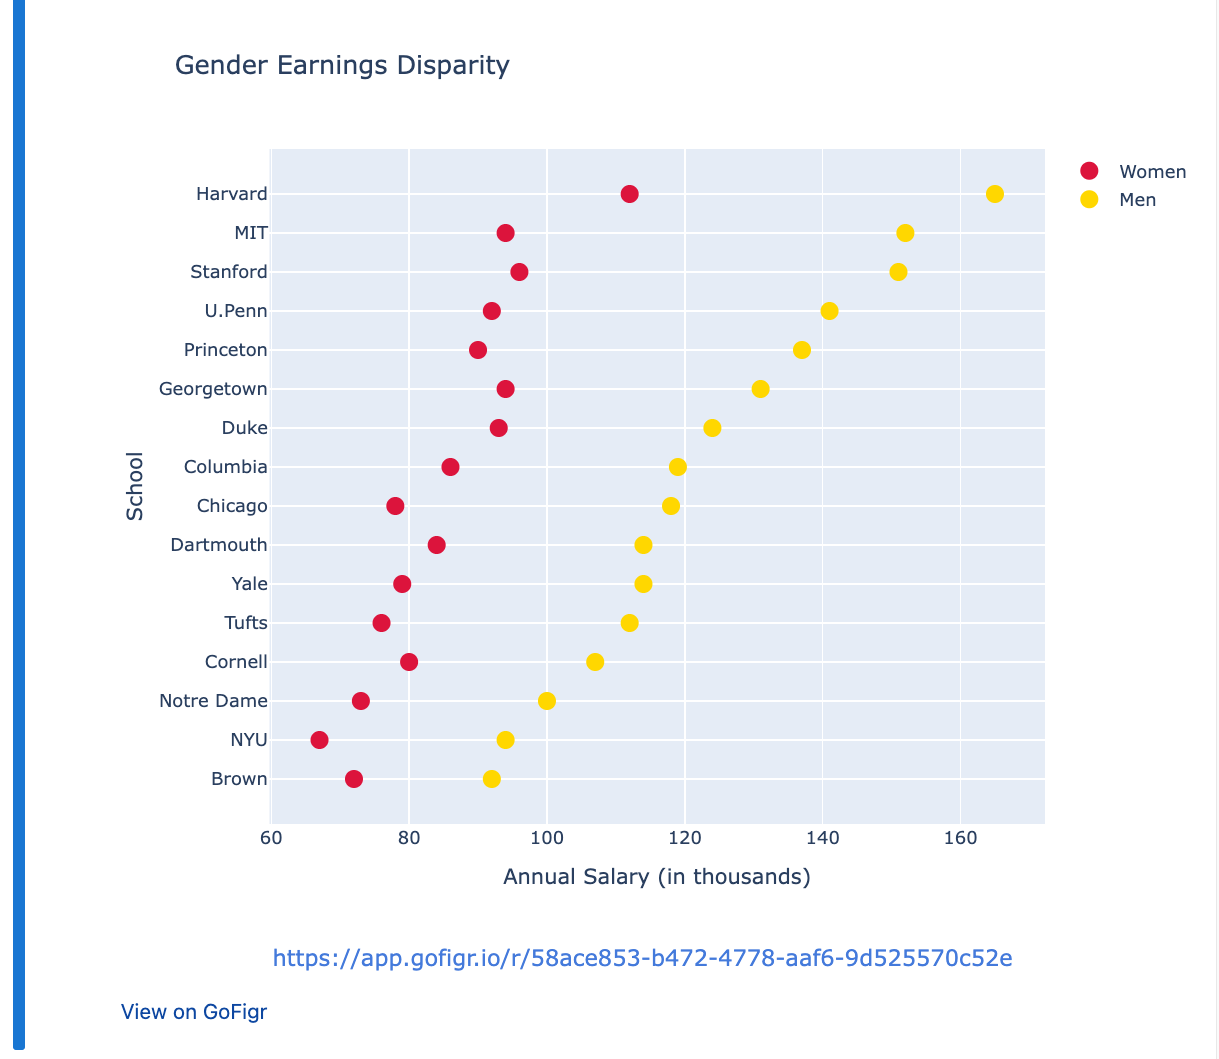
schools = ["Brown", "NYU", "Notre Dame", "Cornell", "Tufts", "Yale",           "Dartmouth", "Chicago", "Columbia", "Duke", "Georgetown",           "Princeton", "U.Penn", "Stanford", "MIT", "Harvard"]
fig = go.Figure()fig.add_trace(go.Scatter(    x=[72, 67, 73, 80, 76, 79, 84, 78, 86, 93, 94, 90, 92, 96, 94, 112],    y=schools,    marker=dict(color="crimson", size=12),    mode="markers",    name="Women",))
fig.add_trace(go.Scatter(    x=[92, 94, 100, 107, 112, 114, 114, 118, 119, 124, 131, 137, 141, 151, 152, 165],    y=schools,    marker=dict(color="gold", size=12),    mode="markers",    name="Men",))
fig.update_layout(title="Gender Earnings Disparity",                  xaxis_title="Annual Salary (in thousands)",                  yaxis_title="School")
publish(fig)  # not necessary if auto_publish=True
You will see your figure displayed inline in Jupyter, alongside a “View on GoFigr link”:
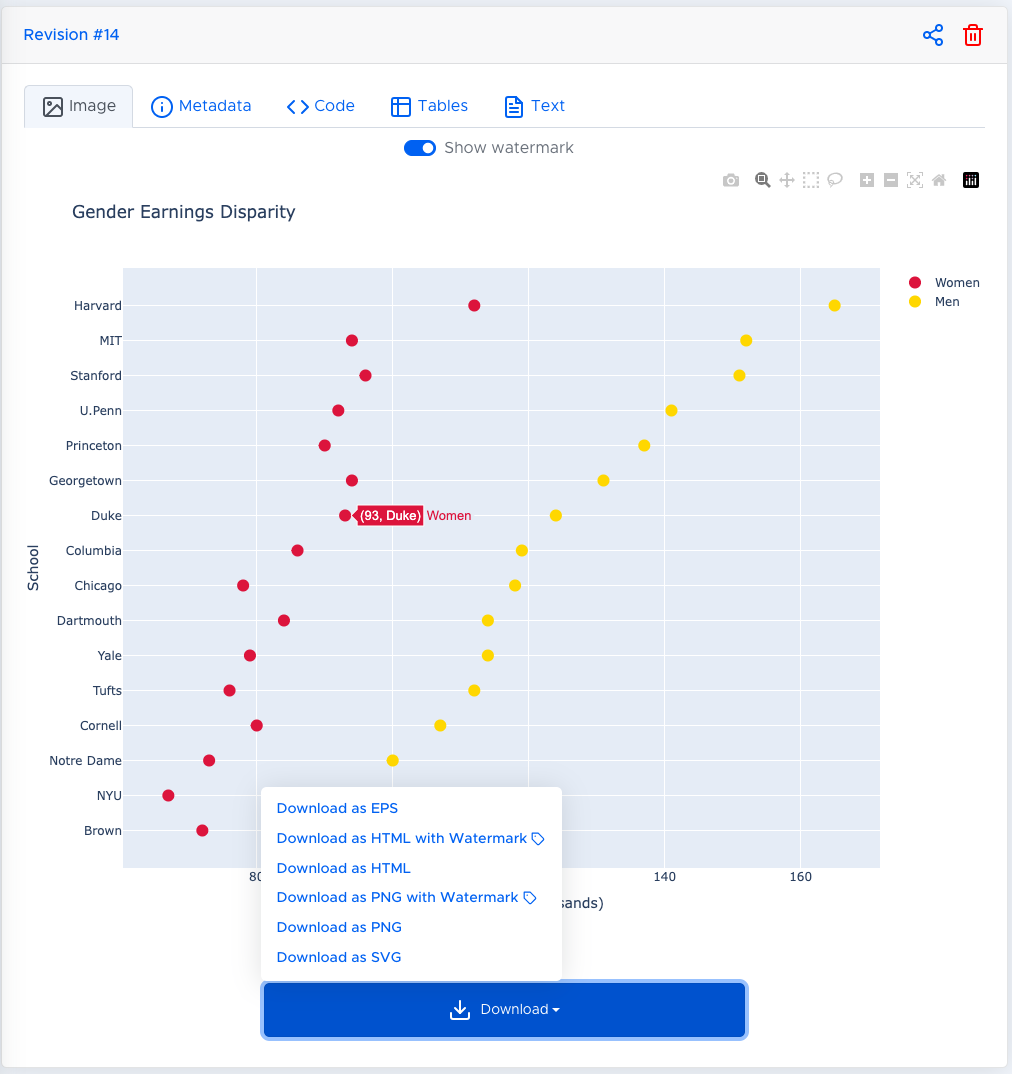
When you then view the figure in the Web UI, the figure will be fully interactive. You will also get the option to download a static image just like Matplotlib:
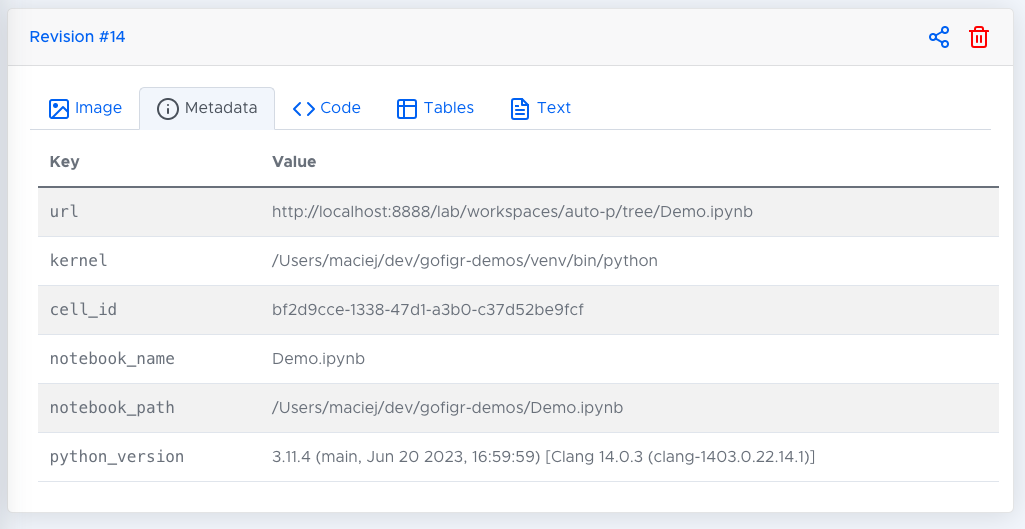
Likewise, GoFigr will store the cell’s code and other relevant metadata:
And that’s it!
As always, please reach out to support@gofigr.io with questions — we’re always here to help!